
Plot4Viz

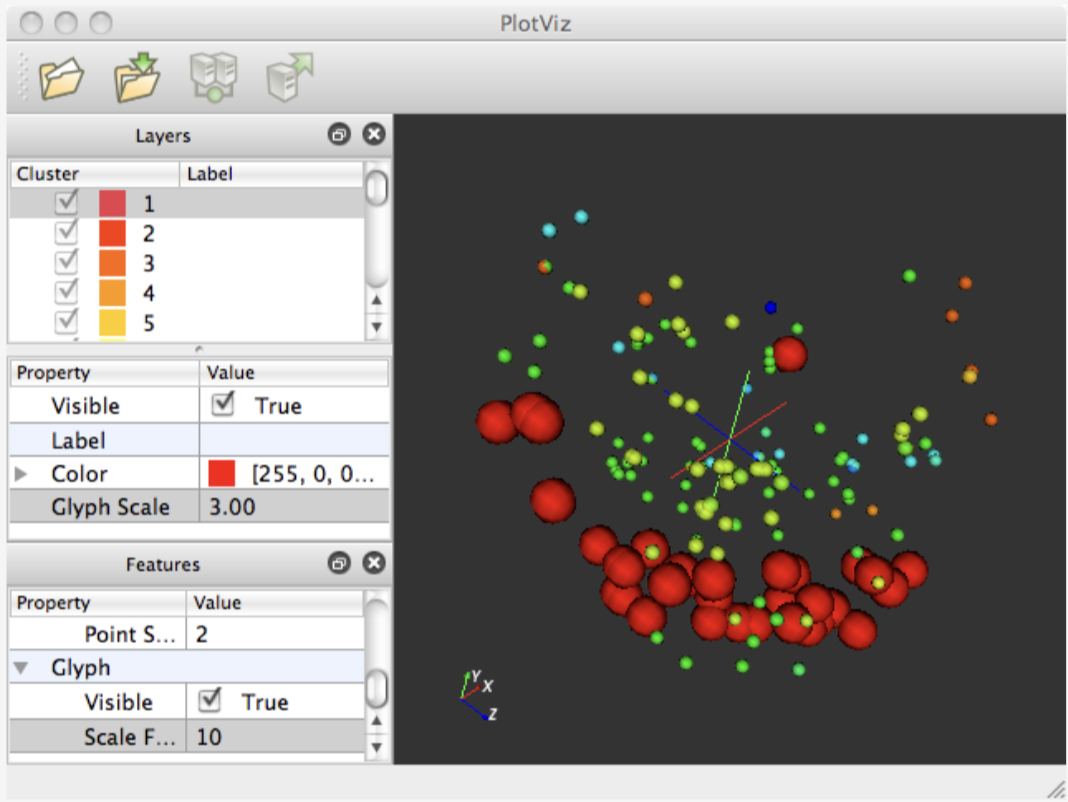
PlotViz is a 3D data point browser that visualizes large volume of 2- or 3-dimensional data as points in a virtual space on a computer screen and enable users to explore the virtual space interactively.
Introduction
Core Features
- 3D data point visualization browser
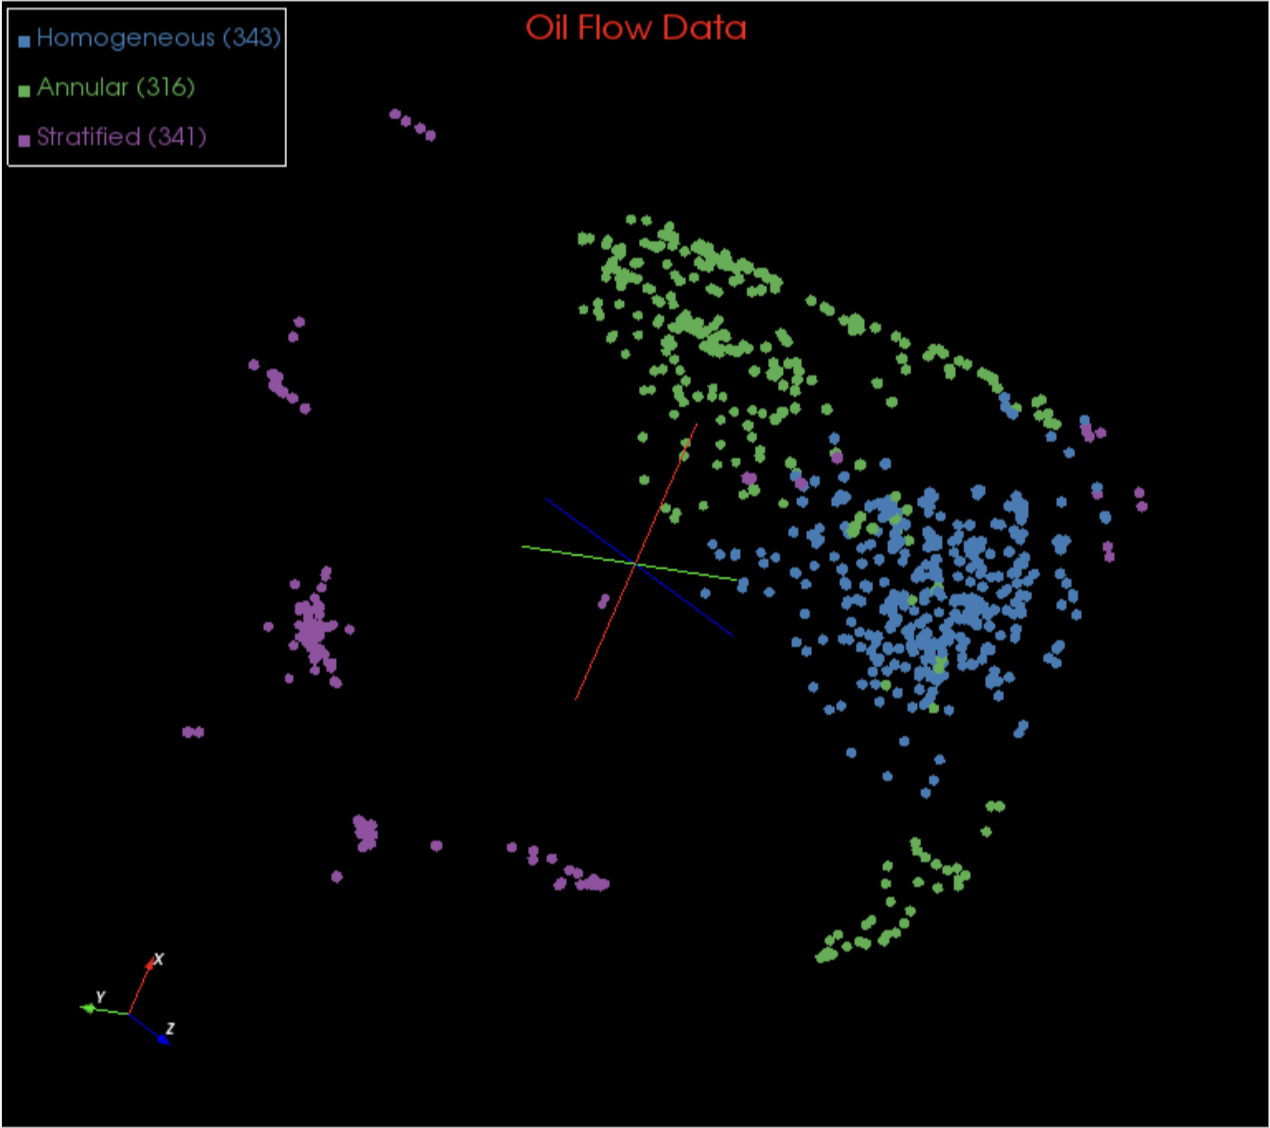
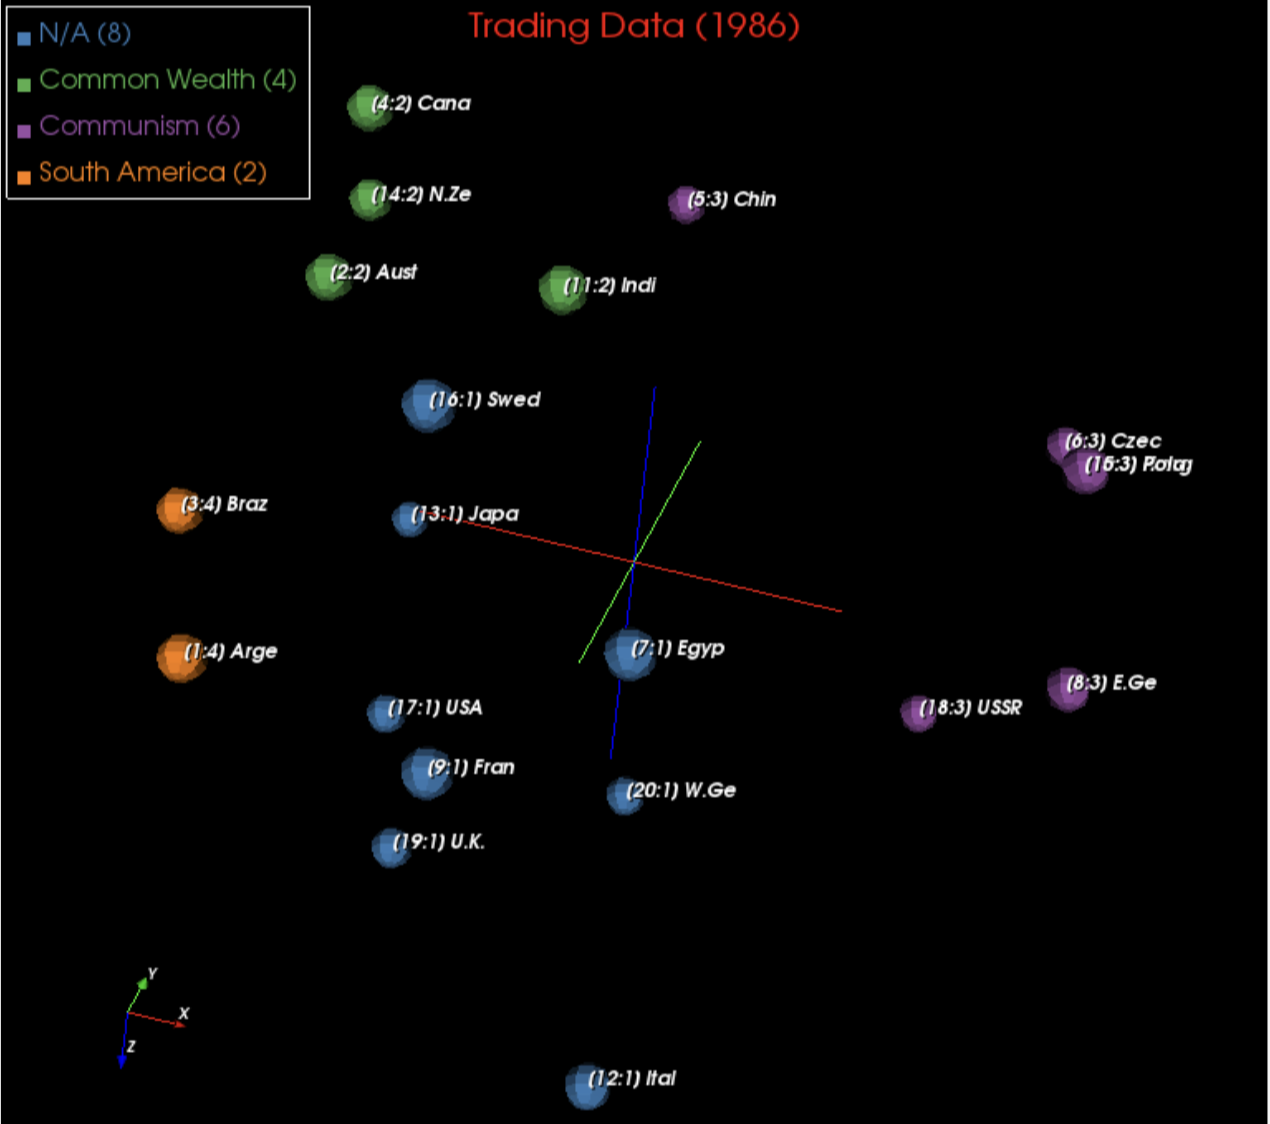
- Handles large-scale high dimensional data
- Interactive virtual space exploration
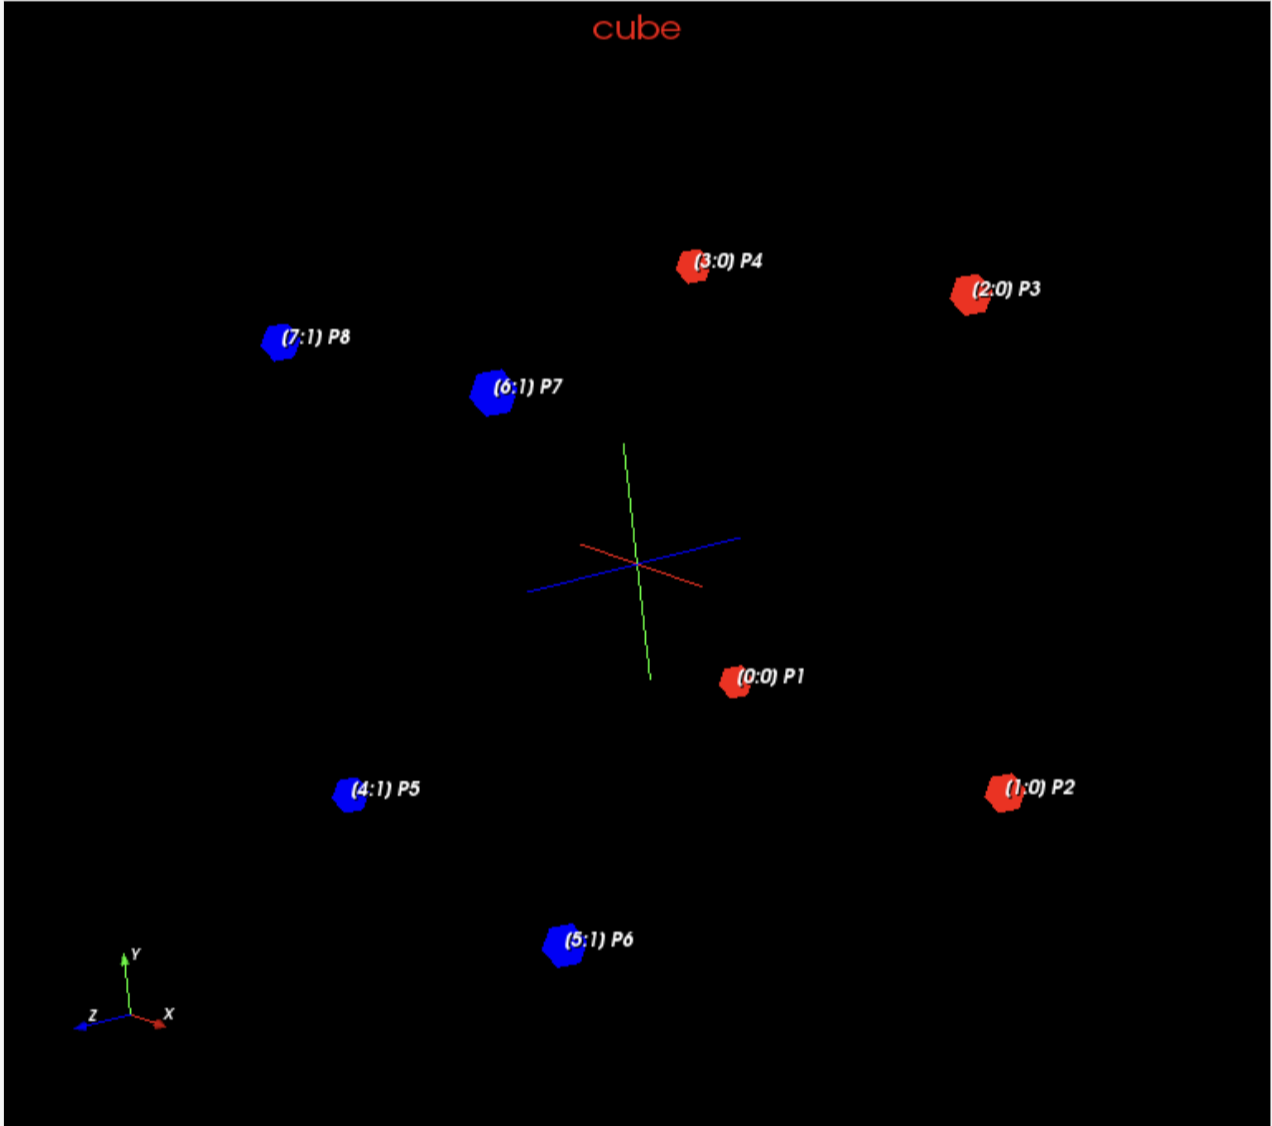
- Supports 2D/3D data rendering
Key Capabilities
- Works with dimension reduction algorithms (MDS, GTM)
- Discovers intrinsic data structures
- Enables efficient browsing of large datasets
- Interactive visualization in virtual 3D space
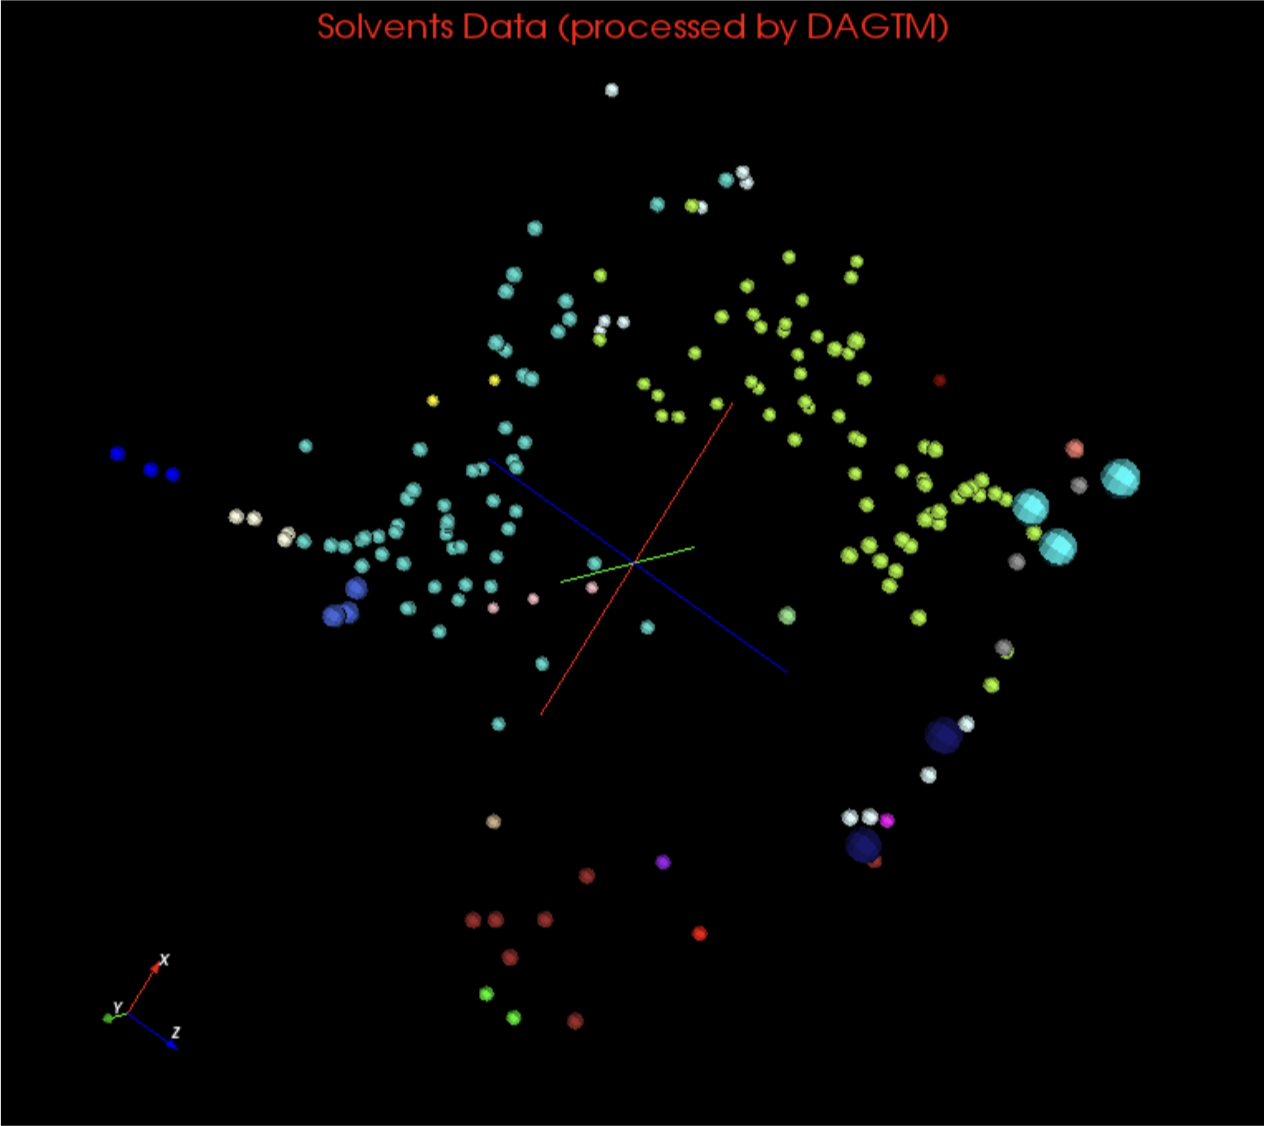
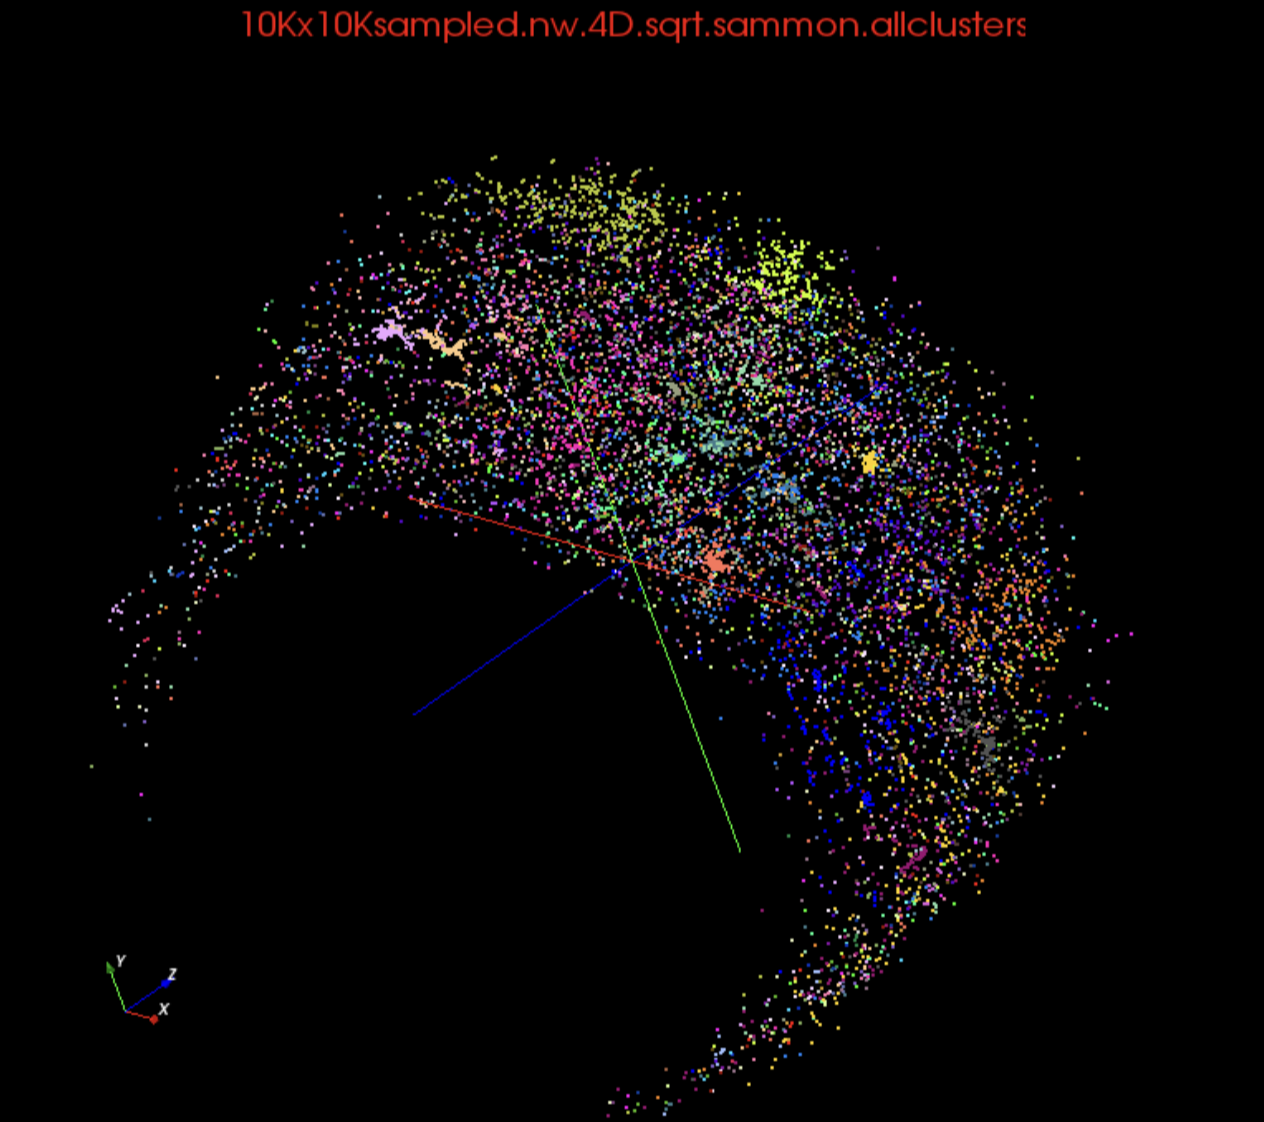
Screenshots
Publications
Jong Youl Choi, Seung-Hee Bae, Judy Qiu, Geoffrey Fox, Bin Chen, and David Wild, “Browsing Large Scale Cheminformatics Data with Dimension Reduction,” Proceedings of Emerging Computational Methods for the Life Sciences Workshop of ACM HPDC 2010 conference, Chicago, Illinois, June 20-25, 2010.
Seung-Hee Bae, Jong Youl Choi, Judy Qiu, Geoffrey Fox, “Dimension Reduction and Visualization of Large High-dimensional Data via Interpolation,” In the Proceedings of ACM HPDC 2010 conference, Chicago, Illinois, June 20-25, 2010
Jong Youl Choi, Judy Qiu, Marlon Pierce, Geoffrey Fox, “Generative Topographic Mapping by Deterministic Annealing,” In the Proceedings of the 10th International conference on Computational Science and Engineering (ICCS 2010), May 31 - Jun 2, 2010. Amsterdam, The Netherlands.
Jong Youl Choi, Seung-Hee Bae, Xiaohong Qiu and Geoffrey Fox, “High Performance Dimension Reduction and Visualization for Large High-dimensional Data Analysis,” In the Proceedings of the The 10th IEEE/ACM International Symposium on Cluster, Cloud and Grid Computing (CCGrid 2010), May 17-20, 2010, Melbourne, Australia.